Power BI - DWH
The purpose of this guide is to explain how to access the DWH what data can be discovered
Note: The C-insight DWH is experimental and may change in it’s future versions
The C-insight DWH data is stored in database called “VulcanDwhDB”.
The Data is updated in near Realtime. You can access this database information, filter it, link
views, and create reports using the Power BI Desktop tool.
Tis section described the basic views, fields and possible values available for analyzing the c-
insight DWH
List all zones that exists in the system, include the zones that are not active
|
Column |
Type |
Description |
|
ZoneId |
Integer |
The Id of the zone |
|
ZoneName |
String |
The name of the zone |
|
Location |
String |
The Polygon of the zone, this is a WKT format |
|
IsActive |
Boolean |
Is the zone active or not |
List all the sensors that exists in the system, include sensors that are not active.
|
Column |
Type |
Description |
|
SensorId |
Integer |
The Id of the zone |
|
SensorName |
String |
The name of the zone |
|
SensorType |
String |
The type of the sensor:
|
|
Location |
String |
The Polygon of the zone, this is a WKT format |
|
IsActive |
Boolean |
Is the zone active or not |
List the events that exists in the C-Insight system
|
Column |
Type |
Description |
|
EventID |
Integer |
The Id of the Event |
|
OrganizationId |
Integer |
The Id of the organization |
|
OrganizationName |
String |
The name of the organization |
|
EventGroupName |
String |
The event Group:
|
|
EventType_ES |
String |
The type of the event (e.g):
|
|
EventSubType_ES |
String |
The Sub Type of the event (e.g):
|
|
EventCreationTime |
Datetime |
The date & time that the event was created |
|
EventClosedTime |
Datetime |
The date & time that the event was closed |
|
LocationPoint |
String |
The location of the event in WKT format |
|
Latitude |
Float |
The Latitude of the event |
|
Longitude |
Float |
The Longitude of the |
|
Severity |
Int |
The severity Of the event |
|
IsClosed |
Boolean |
Is the Event is closed true/false |
|
IsClosedAsFalseAlarm |
Boolean |
In case that the event is closed, was it closed as “False Alarm” |
|
IsClosedAsUnhandled |
Boolean |
In case that the event is closed, was it closed as unhandled |
|
IsManualEvent |
Boolean |
Is the event was created manually or by the system true(Manual)/false(System) |
|
ZoneId |
Integer |
The ID of the zone |
|
ZoneName |
string |
The name of the zone |
List the LPR Detections for each of the events of type LPR, each event can have multiple detections.
|
Column |
Type |
Description |
|
EventID |
Integer |
The Id of the Event |
|
OrganizationId |
Integer |
The Id of the organization |
|
OrganizationName |
String |
The name of the organization |
|
EventGroupName |
String |
The event Group:
|
|
EventType_ES |
String |
The type of the event (e.g):
|
|
EventSubType_ES |
String |
The Sub Type of the event (e.g):
|
|
EventCreationTime |
Datetime |
The date & time that the event was created |
|
EventClosedTime |
Datetime |
The date & time that the event was closed |
|
LocationPoint |
String |
The location of the event in WKT format |
|
Latitude |
Float |
The Latitude of the event |
|
Longitude |
Float |
The Longitude of the |
|
Severity |
Int |
The severity Of the event |
|
IsClosed |
Boolean |
Is the Event is closed true/false |
|
IsClosedAsFalseAlarm |
Boolean |
In case that the event is closed, was it closed as “False Alarm” |
|
IsClosedAsUnhandled |
Boolean |
In case that the event is closed, was it closed as unhandled |
|
IsManualEvent |
Boolean |
Is the event was created manually or by the system true(Manual)/false(System) |
|
ZoneId |
Integer |
The ID of the zone |
|
ZoneName |
string |
The name of the zone |
|
DetectionID |
Integer |
The id of the detection |
|
DetectionCreationTime |
Dateime |
The Date & time that the detection was created |
|
SensorId |
Integer |
The ID of the sensor |
|
SensorName |
string |
The name of the sensor |
|
Make |
string |
The make of the vehicle |
|
Model |
String |
The model of the vehicle |
|
ModelYear |
String |
The Year that the model was manufactured |
|
Color |
String |
The color of the vehicle |
|
PlateNumber |
String |
The Plate Number of the vehicle |
|
Speed |
Integer |
The Speed that the vehicle was driving |
|
Direction |
string |
|
|
Confidence |
Integer |
The Confidence that of the vehicle information |
List the Volume (Count) of Face detections the system received from Face Sensor per day and hour
|
Column |
Type |
Description |
|
[DetectionHour] |
DateTime |
The Id of the zone |
|
[DetectionDate] |
Date |
The name of the zone |
|
[SensorId] |
INT |
The ID of the sensor |
|
[SensorName] |
String |
The name of the sensor |
|
[Volume] |
Integer |
The number of detections |
List all the Volume (Count) of LPR detections the system received from LPR Sensor per day and hour
|
Column |
Type |
Description |
|
[DetectionHour] |
DateTime |
The Id of the zone |
|
[DetectionDate] |
Date |
The name of the zone |
|
[SensorId] |
INT |
The ID of the sensor |
|
[SensorName] |
String |
The name of the sensor |
|
[Volume] |
Integer |
The number of detections |
This section describes how to download Power-BI, connect to C-Insight DWH and create dashboard on C-Insight DWH.
For detailed description of how to use the Power-BI you may refer to the tutorials or video explaining it uses:
https://www.youtube.com/watch?v=AGrl-H87pRU
For downloading power BI please use the following link from Microsoft.
https://www.microsoft.com/en-us/download/details.aspx?id=58494
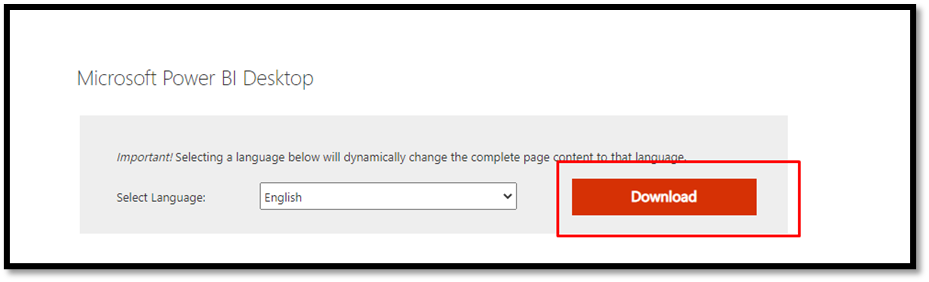
click on the download link in order to download the PowerBI desktop
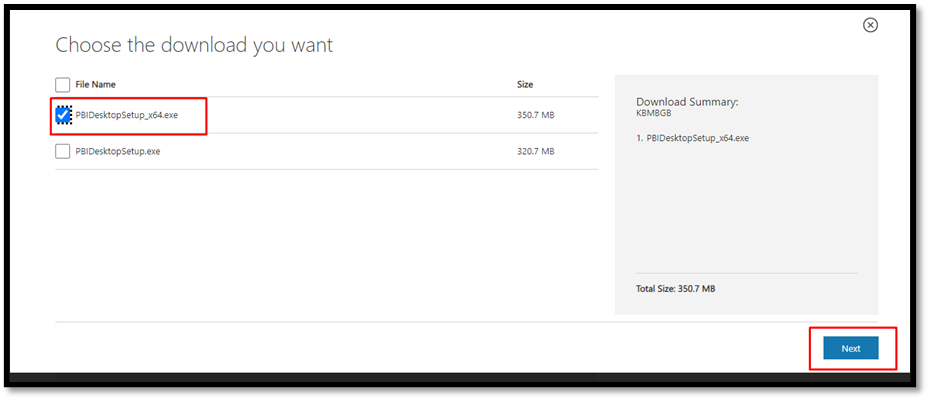
After the download is completed, run the installer and install the power-Bi desktop
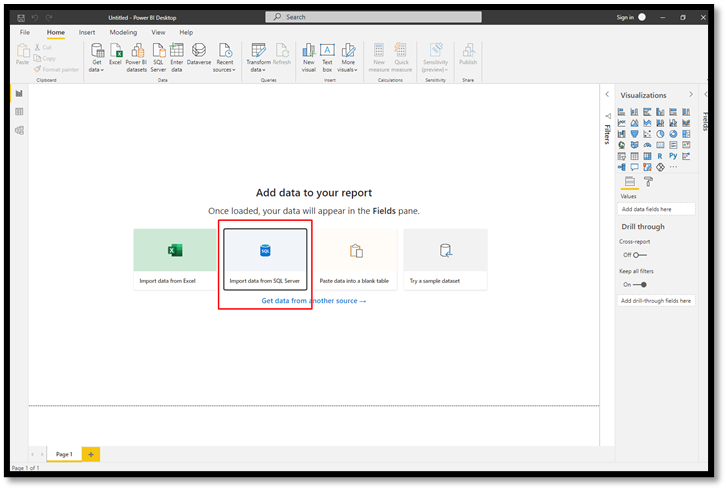
Open the power-BI, by clicking the Power-BI icon ![]() on the desktop.
on the desktop.
When the power-Bi window is opened Click: “Import From SQL Server”
Next: Enter the server & Database details and click OK
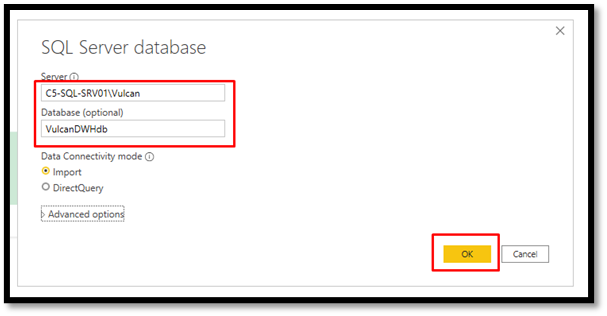
Next: Enter the credentials in order to connect to the database and click Connect.
use the following, User:AnalysisUser Password: AnalysisUser
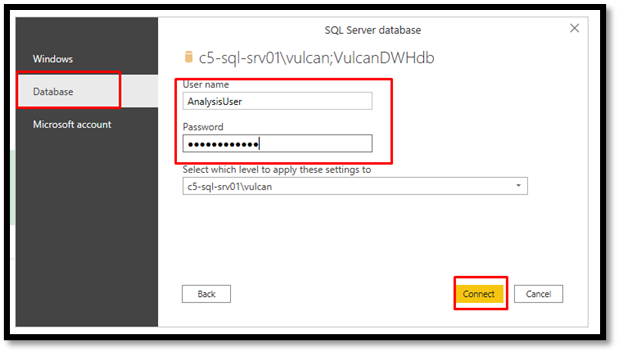
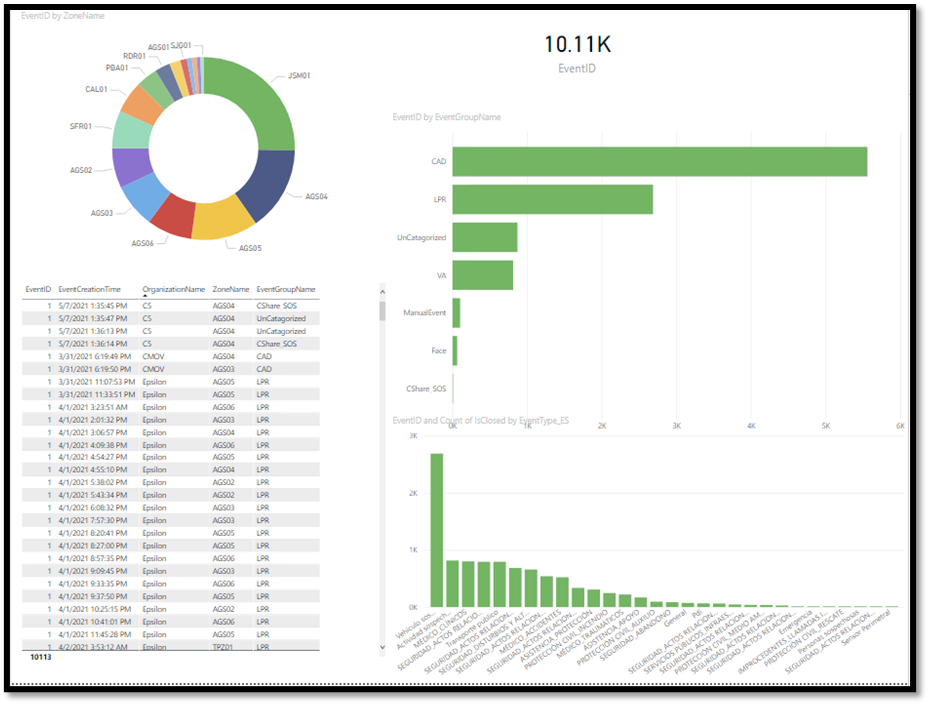
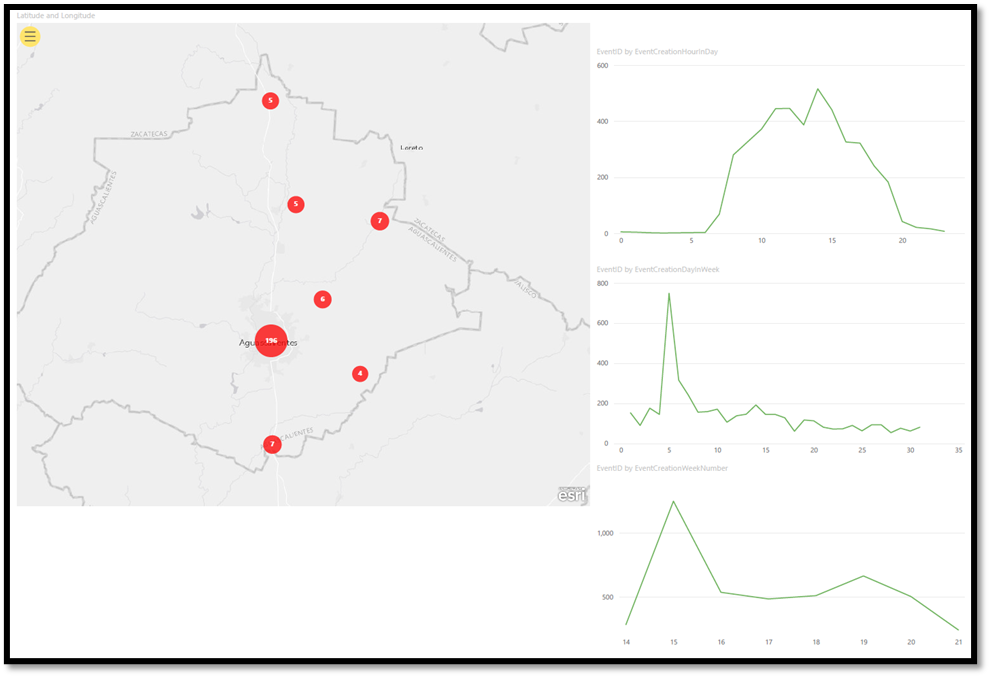
Figure 99Distribution of LPR Stolen Vehicle events
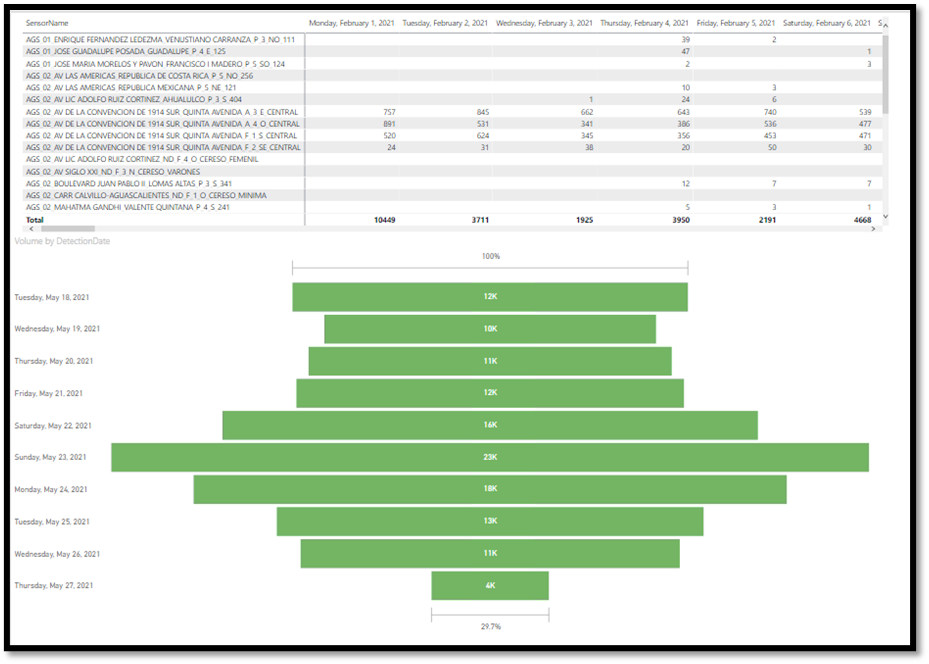
Figure 100LPR Detections Counts with Funnel Graph
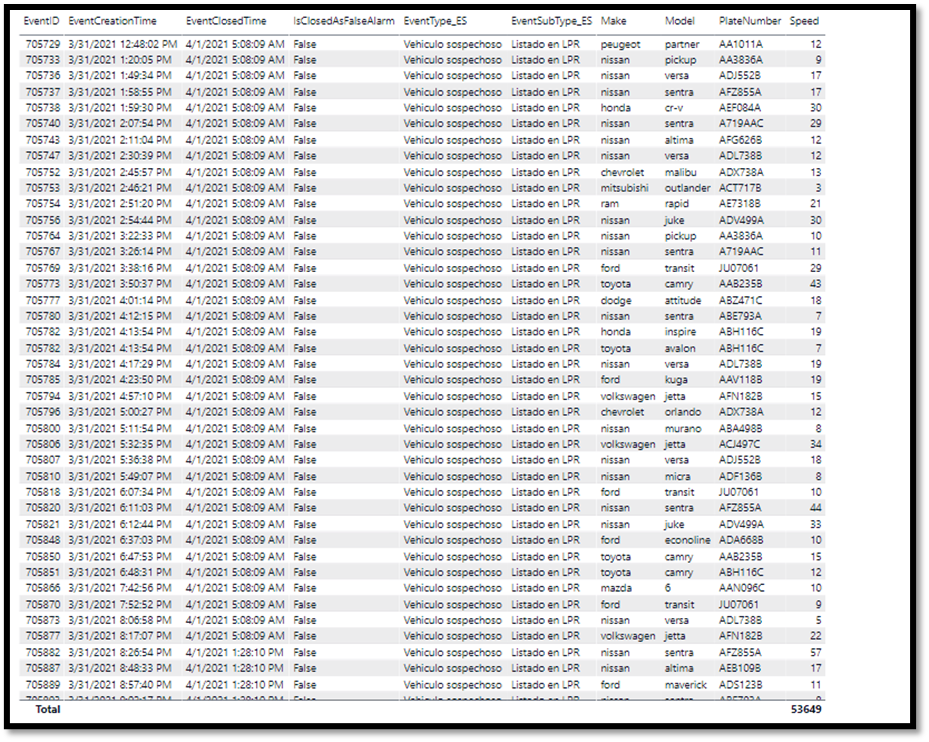
Figure 101LPR Events information for the last X days
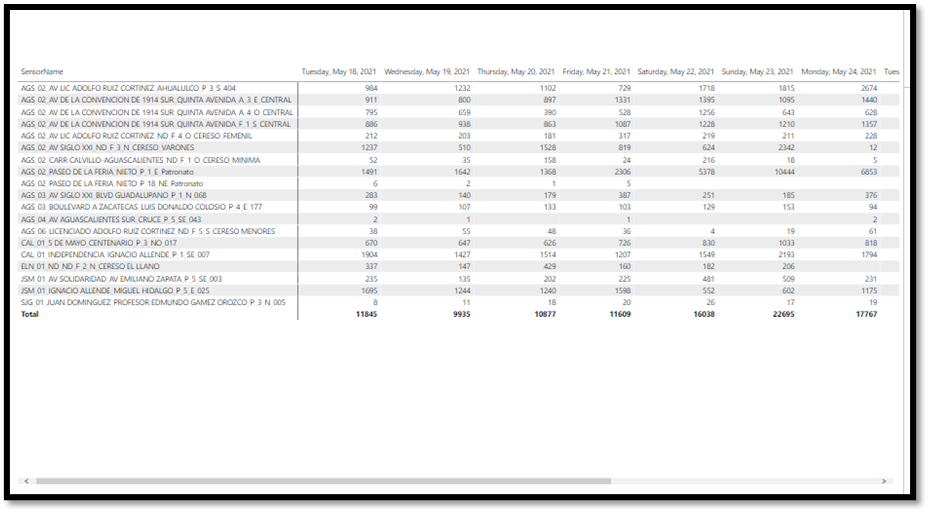
Figure 102Distribution Of face detection per Face Camera
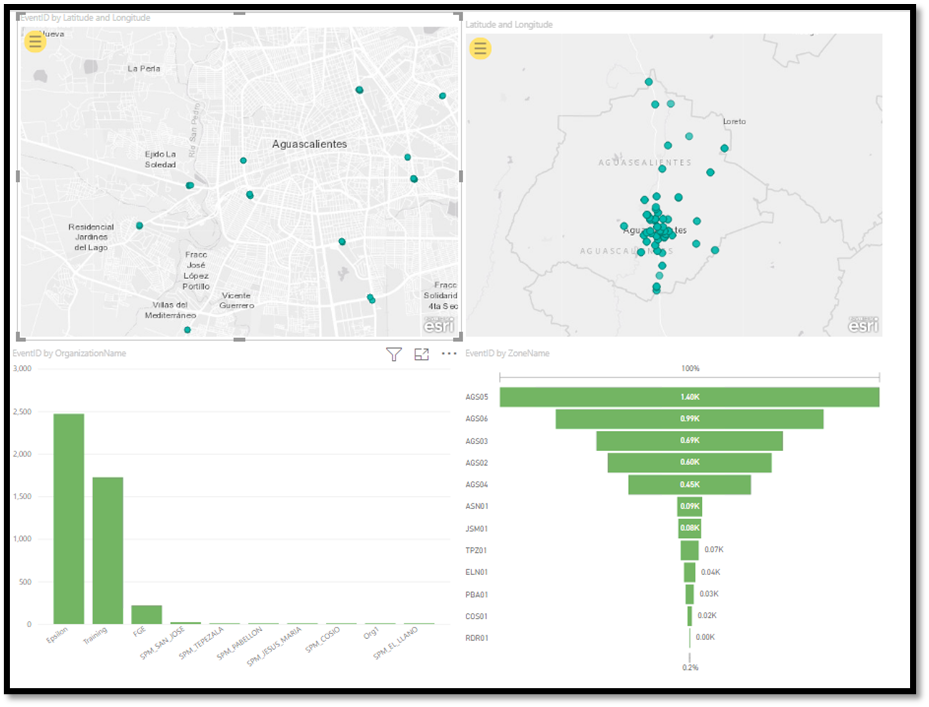
Figure 103Distribution Of events per organizations + on Map
Created with the Personal Edition of HelpNDoc: Generate Kindle eBooks with ease